Loading Data PowerPivot
In the previous posts, we have been adding tables to the data model from Excel. However this method is inefficient, as PowerPivot can load data directly into the data model, without going through Excel. By doing so, we only need to load the data once, and it loads as compressed data into memory. When loading, Excel does not compress data so the resulting size of the file is around 10 times larger at times when loaded through Excel rather than PowerPivot (sizes from previous posts). Also, Excel is limited to storing 1 million rows, and PowerPivot can handle hundreds of millions of rows in memory. So loading data into first into Excel then into PowerPivot can hit the limit of rows and curb efficiency.However, the data in the data model cannot be edited in PowerPivot, and can be edited in Excel. This can help prevent unwanted modification to the data set in PowerPivot as it is read-only. If the data set is loaded into Excel, all Excel editing features are available. Despite being read-only in PowerPivot, it is possible to add new columns to the original tables by using DAX language, but the original tables stay the same.
Loading from the AdventureWorks Database
In the PowerPivot tab, click on the Manage button to open the PowerPivot window.| Fig. 1: Manage Data Model button |
| Fig. 2: Get External Data Button in PowerPivot |
 |
| Fig. 3: Access Database Table Import Wizard |
 |
| Fig. 4: Microsoft SQL Server Table Import Wizard |
 |
| Fig. 5: Choosing How to Import the Data Window |
 |
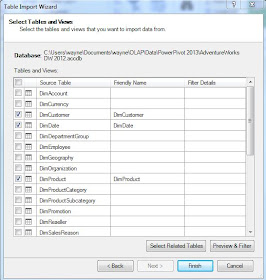
| Fig. 6: Selecting the Tables |
 |
| Fig. 7: PowerPivot Diagram View |
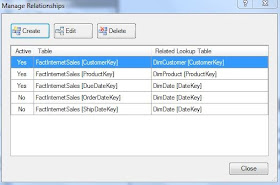
Under the Design tab, clicking Manage Relationships will allow us to modify relationships between tables. The current relationships between the four tables in our data model are shown below in Figure 8.
 |
| Fig. 8: Manage Relationships Window in the Data Model |
Creating a PivotTable in PowerPivot
After we have loaded the data into PowerPivot, we can create a PivotTable from the data model. Select the PivotTable button under the Home tab, highlighted in Figure 9.| Fig. 9: PivotTable Button in PowerPivot |
 |
| Fig. 10: Determining the Location of the New PivotTable |
 |
| Fig. 10: Blank PivotTable Created from PowerPivot |
- Color from the DimProduct table to Rows quadrant,
- CalenderYear from the DimDate table to the Columns quadrant,
- SalesAmount from the FactInternetSales table to the Values quadrant.
 |
| Fig. 11: SalesAmount by Color by CalendarYear PivotTable |
In the next post we will create calculated columns and calculated fields into the PivotTable we just realized.
Thanks for reading,
Wayne
No comments:
Post a Comment