Loading...
Showing posts with label tokens. Show all posts

Monday, December 16, 2013

Querying Trends with Twitter API Using Python


Hello Readers,

Hope you guys are keeping warm! Today we will be talking about mining the rich metadata of Twitter through their Twitter REST API v1.1 by using Python (I will use IPython 2.7.5 and the python twitter library). Specifically, we will look at trending topics. (For Part 2: Tweets, click here).

Let us begin.


For Starters


A Twitter account (my handle is @beyondvalence) is required to obtain the proper authorization keys to access the Twitter API. Go here to use your Twitter account to obtain developer credentials and keys. OAuth offers a solution for apps to access user Twitter data without requiring users to share sensitive information such as passwords. A sample of the Twitter development page with the OAuth keys is shown below.


Twitter OAuth Keys
Next, install the twitter library into Python by using the pip install in the command console. 


In IPython 


In the python IDE, we now can import twitter and json (JavaScript Object Notation) libraries, simple enough.
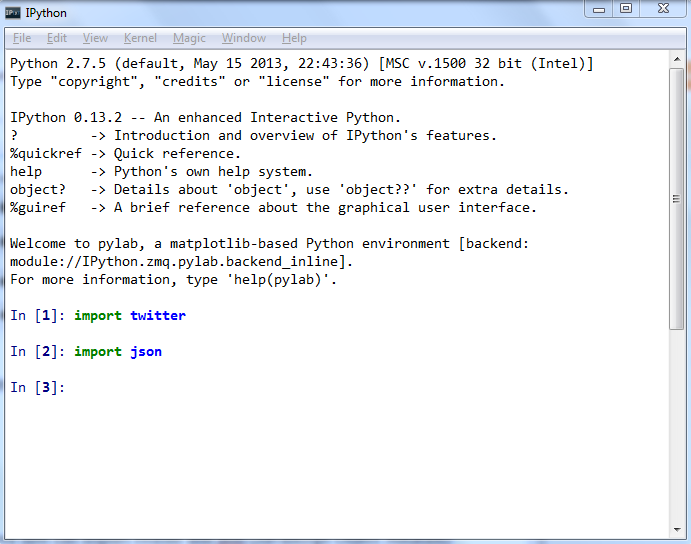

Import Twitter and JSON

Next, we define the OAuth keys as consumer, consumer_secret, oauth_token, and oauth_token_secret. Using these keys, create an OAuth authorization object, such as auth, shown below (line 4). Then auth is passed to class Twitter to issue queries to the Twitter API.


Gained Twitter API Query Access

The Twitter object print-out in line 5, above, indicates that we have used OAuth credentials to gain authorization to query Twitter's API.


Querying Trend Topics


Moving along! Now that we are authorized, we can issue a request. A common measure of topics in the Twitterverse is compiled in trends- which are popular tokens such as key words, handles, or hashtags. We can request the current trending topics on Twitter (as of this blog post writing in mid December).

Yahoo has developed an unique, non-repetitive way to index places by using the WOE (What On Earth) identifier. So we can use these WOE IDs to constrain our queries to Twitter, by using the 1 and 23424977 IDs for the entire world and the US, respectively. This is shown below. (The id requires an underscore to denote it as a query string parameterization.)


Twitter Trends Output

The result is a lot of text, much of it semi-readable at best. Deciphering the output is made easier to view by using JSON formatting.


JSON, a Data Exchange Format


We imported the json library at the beginning, and now we can print the API output in JSON. Do this for the trends in the US, by using print json.dumps(). This is shown below.


API Output JSON Format

Much better! As we can see some trending topics in the US are:


  • #LastMinuteGifts (Makes sense, being in the Holiday shopping season)
  • #SOTV
  • #AskHartnell
  • Christmas (just around the corner)
  • 22 Jump Street (a comedy movie)
And trending topics in the world include:

  • #YeterArt
  • #MilletinVekiliHakan
  • #SessizSakinTakiple
  • #TMP332
  • Julie Plec Needs Kol


Note: Twitter Rate Limits

Twitter has rate limits on applications constraining the number of requests one can make to an API at 15 requests in a 15 minute time window for trends. It is not a big concern considering the trends are updated every 5 minutes anyways.

Later posts will discuss more Twitter metadata, like tweets! Stay tuned for Part 2, Querying Tweets!

Thanks for reading &
Have a wonderful Holiday! 


Wayne
@beyondvalence

Thursday, December 12, 2013

Visualizing Twitter Tokens- Hashtags, Smileys and URLs in R


Hello Readers!

Tweet, Tweet!
Welcome back to the blog. Today we will discuss how to visualize Twitter tokens trends in tweets, specifically:


The data was obtained from the infochimps site, where they also host data sets for other platforms. For analysis I will be using RStudio.

Let us get started.


The Loading


Unpacked Zip File Content
Once we have downloaded and unzipped the 'tokens by month' data set, we can go ahead a read the tsv file (tab separated values) into R. Use the str() function to get an idea of the data structure.


Reading in Total Tokens by Hour tsv
Looking at the structure, we see that there are 3 columns with 67,992 observations consisting of "tweet_url", "smiley", or "hashtag". The X column denotes the 4 digit year, month, day, and hours in 24 hour format, followed by the count in the X1 column. Use the table() function to determine how many token measures we have of each, and also to check for spelling errors.


Token Measures
We see there are 18,401 hashtag measures, 25,137 smiley measures, and 24,454 tweet_url measures. Keep in mind these are not counts- they are just the number of times the tokens were measured in the data set. The actual counts are in column 3, X1. To obtain the total counts for each measure, we use tapply() to apply a function by index. The totals are shown above, with tweet_urls coming in top at 167,819,007! It seems that people are tweeting more internet links than hashtags and smileys put together.


The tokens() Function


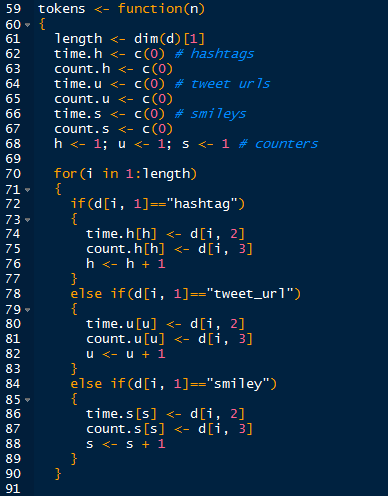
Next we write the tokens() function. Keep in mind of the variables we have to track when we separate the all the information pertaining to the three different tokens. At the same time, I want to convert the dates into an usable Date.Time format. Putting it together, the result will be a list containing the date and count of the hashtag, smiley, and tweet_url tokens.

The first part of the function is shown below.


Token Function Part 1
 We start the function by initializing the variables we need to keep track of and using counters to progress the variables along through each successive record (h, u, and s) of their respective time and count variables in the for loop. We take the pertinent data from each type of token into their own variables to put in a list. 

Next, we take the date variables and convert them into Date.Time format using the strptime() function, shown below. Afterwards, we create the list and instruct the function to return the tokens list. Now run the tokens () function.


Token Function Part 2
Finally, use the completed tokens() function to create the t.tokens list.


The Plotting


Now that we have the tokens in a convenient list, we can visualize the token trends with a plot. Naturally, use the plot() function, a sample method is show below.


Plotting the Hashtag Count
 The second section will create the x axis labels consistent with the Date.Time values in the t.tokens$count.h variable. It will plot the year and month for better readability.

Hashtag Count Plot

We will add the two other tokens next using the lines() function. And to finalize the plot, we will add a legend to interpret which line is which token.


Adding Smiley and URL Count Lines

Now we have the finished plot!

Plot of All Three Token Counts Over Time

Note that starting in January of 2009, user activity, especially in URL content are beginning to spike above the previous background levels. Observe that drastic spikes in URL counts in July and October of 2009 also coincided with hashtag and smiley counts as well. The increases in content can be attributed to the increased in Twitter users, starting in 2009. 

Stay tuned for more Twitter analysis!

Thanks for reading!


Wayne