Hello Readers!
 |
| Tweet, Tweet! |
- hashtags #
- smileys =)
- and URLs http://youtu.be/iPSXDDg-aZw
The data was obtained from the infochimps site, where they also host data sets for other platforms. For analysis I will be using RStudio.
Let us get started.
The Loading
 |
| Unpacked Zip File Content |
 |
| Reading in Total Tokens by Hour tsv |
 |
| Token Measures |
The tokens() Function
Next we write the tokens() function. Keep in mind of the variables we have to track when we separate the all the information pertaining to the three different tokens. At the same time, I want to convert the dates into an usable Date.Time format. Putting it together, the result will be a list containing the date and count of the hashtag, smiley, and tweet_url tokens.
The first part of the function is shown below.
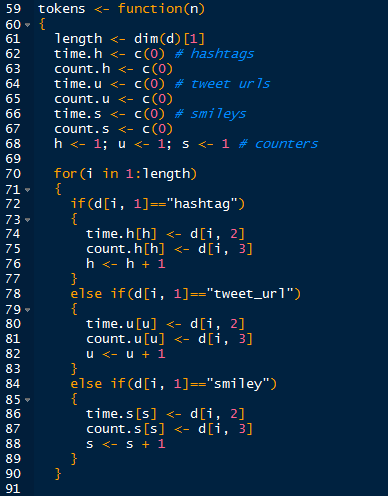 |
| Token Function Part 1 |
Next, we take the date variables and convert them into Date.Time format using the strptime() function, shown below. Afterwards, we create the list and instruct the function to return the tokens list. Now run the tokens () function.
 |
| Token Function Part 2 |
The Plotting
Now that we have the tokens in a convenient list, we can visualize the token trends with a plot. Naturally, use the plot() function, a sample method is show below.
 |
| Plotting the Hashtag Count |
 |
| Hashtag Count Plot |
We will add the two other tokens next using the lines() function. And to finalize the plot, we will add a legend to interpret which line is which token.
 |
| Adding Smiley and URL Count Lines |
Now we have the finished plot!
 |
| Plot of All Three Token Counts Over Time |
Note that starting in January of 2009, user activity, especially in URL content are beginning to spike above the previous background levels. Observe that drastic spikes in URL counts in July and October of 2009 also coincided with hashtag and smiley counts as well. The increases in content can be attributed to the increased in Twitter users, starting in 2009.
Stay tuned for more Twitter analysis!
Thanks for reading!
Wayne
I am new to analytics using twitter, The link provided for downloading the twitter tokens dataset seems to be broken, can you please provide me a alternate link.
ReplyDeleteI am new to analytics using twitter, The link provided for downloading the twitter tokens dataset seems to be broken, can you please provide me a alternate link.
ReplyDelete