Loading...

Thursday, November 14, 2013

P4.3: Data Modeling in PowerPivot: SQL Query Denormalization

Hello Readers,

This post is a continuation from the last post of understanding normalization in data modeling using PowerPivot. As usual, we will be using the AdventureWorks companion material from the Ferrari book. Let us get started.


SQL Querying in PowerPivot


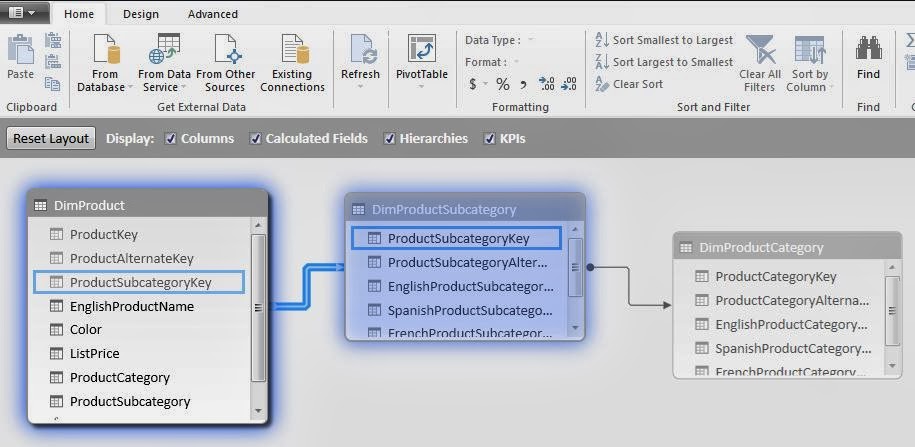
In the previous post I demonstrated how to denormalize a table in PowerPivot by creating calculated columns using the RELATED command. The RELATED command is an easy tool to understand denormalization. However, with SQL queries we can normalize with ease in a large database. Here we will query in SQL the necessary columns and tables to denormalize a data model. The denormalization process will be shifted outside of PowerPivot versus the previous method of denormalizing within PowerPivot using the RELATED command.


A SQL query is a statement written in SQL language used in many modern relational databases. PowerPivot has a built-in SQL query designer, of which we will discuss further.


Begin by adding AdventureWorks data from SQL Server. In the Home tab of PowerPivot, click from Database and From SQL Server option.


Fig. 1: Add External Data from SQL Server in PowerPivot
The Table Import Wizard will appear. Type in the Server name and select the Database name from the drop-down menu. In this case, the AdventureWorks tables are located in the POWER Database.


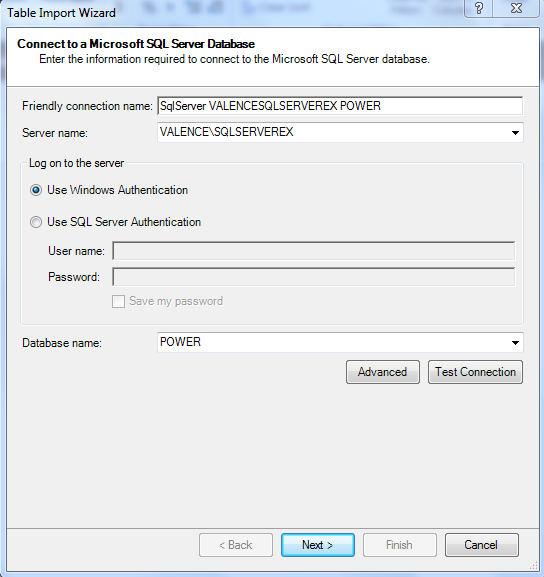
Fig. 2: Connecting to SQL Server Database
After a connection is established, select Write a query because we will demonstrate how to use SQL queries to denormalize a data model.


Fig. 3: Use Query Method
Next we are given the option to enter the SQL query. Knowing SQL, we can type in:

SELECT
  DimProduct.ProductKey
  ,DimProductCategory.EnglishProductCategoryName
  ,DimProductSubcategory.EnglishProductSubcategoryName
FROM
  DimProductSubcategory
  INNER JOIN DimProductCategory
  ON DimProductSubcategory.ProductCategoryKey = DimProductCategory.ProductCategoryKey
  INNER JOIN DimProduct
  ON DimProductSubcategory.ProductSubcategoryKey = DimProduct.ProductSubcategoryKey

But for now, click the Design button as show below in Figure 4 to use the SQL query designer.


Fig. 4: Select PowerPivot Query Designer
With the SQL query Designer open, select the ProductKey from DimProductEnglishProductCategoryName from DimProductCategory, and EnglishProductSubcategoryName from DimProductSubcategory.


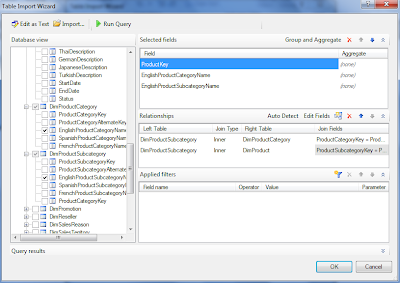
Fig. 5:  SQL Query Designer
In the Relationships section, the DimProductSubcategory has the Primary Keys to the categories and subcategories to the DimProduct and DimProductCategory tables. This illustrates the one-to-many relationship, indicated by the left and right tables. The Join Fields are shown in Figure 5 as well. Now click OK, and we get SQL query statement designed by the point and click SQL query designer (Figure 6.)


Fig. 6: SQL Query Statement from SQL Query Designer
Hitting Finish, the Table Import Wizard implements the query statement and imports the specified table into the PowerPivot database.


Fig. 7: Query Table
Now we have denormalized a data model by using SQL queries to retrieve columns from different tables into one table. Note that 397 rows were imported. This is less than the 606 rows in the DimProduct. Where did the other 209 rows go? The 397 rows from the query is a result of the type of relationship between the tables, in this case is an INNER JOIN, which only returns rows with matching values in both tables. The next post will discuss the different types of JOINS.


Thanks for reading,


Wayne

Thursday, November 7, 2013

P4.2: Data Modeling in PowerPivot: Normalization and Denormalization

Hi Readers, 
Today we will discuss normalization and denormalization of tables in data models. As usual, we will being using the companion material from the Ferrari book. We will be continuing on the data model from the previous post. Let us get started.

Normalization


In the previous post we discussed relationships between tables in the data model with products, product categories, and product subcategories. That particular data model is considered to be normalized. What does it mean to be normalized? Instead of having one detailed table with all the category and subcategory information for each product, the category and subcategory information is referenced in their own tables. This way, the categories and subcategories are not repeated multiple times with each product and allow for efficient data storage. Normalization increases the number of tables, but decreases the overall size of the database by removing redundancies.


Fig. 1: Normalized Product Data Model

Inside the DimProduct table, instead of a product subcategory column listing the subcategories, it has numbers referencing the DimProductSubcategory table. Below in Figure 2, we see that the subcategories are only listed once (which is why the ProductSubcategoryKey column must be an unique Primary Key.) This reduces redundancy of listing the each subcategory multiple times for the products in the DimProduct table.

Fig. 2: DimProductSubcategory Table

Although another table (DimProductSubcategory) was created by normalizing, it occupies less overall physical hard drive space. However, viewing the product data model information as a set of normalized tables from the user perspective is difficult and not logical. Once a database is normalized for storage, the required data must be denormalized for readability when retrieved to be analyzed.

Denormalizing (Reducing Normalization)


For this product data model, we can easily create calculated columns for the product categories and subcategories in the product table and hide the product category and subcategory tables in the model. This would reduce the normalization, thus increasing the complexity and physical storage size of the product table.

In the DimProduct table in PowerPivot, create a calculated column for the ProductCategory using the DAX expression:

  =RELATED(DimProductCategory[EnglishProductName])

as shown below:

Fig. 3: RELATED DAX Expression for ProductCategory
And again for the ProductSubcategory column with the DAX expression:

  =RELATED(DimProductSubcategory[EnglishProductSubcategoryName])

again, shown below:

Fig. 4: RELATED DAX Expression for ProductSubcategory

Now the DimProduct table has decreased normalization and more redundancy, with product categories and subcategories being repeated multiple times, but is more readable for the user. To finish, we can hide the other two tables which are now not required since the relevant data is in our desired product table.

To hide the DimProductCategory and DimProductSubcategory tables, in the PowerPivot Diagram View, right-click the table and select Hide from Client Tools. Normalized tables which are needed for the data model, but can be safely hidden are called technical tables

Fig. 5: Hide from Client Tools, Table

Additionally, the ProductSubcategoryKey, as the Foreign Key in the DimProduct table, is now not required because the table has been denormalized with the actual subcategory column in the table. Yes, it can be hidden too (along with ProductKey and ProductAlternateKey.)

Fig. 6: Hide from Client Tools, Column

Hiding technical tables and technical columns, as well as removing normalization are important steps to improving the usability of a data model. Though relational databases use normalization,  denormalized tables offer ease for analysis and querying, while a normalized data model removes redundancy, occupies less disk space, and improves database operational performance.

Either option can be right or wrong depending on the scenario, and the operations we would like to perform on it. In the next post, I will discuss denormalizing with SQL queries.


Thanks for reading,


Wayne

Tuesday, November 5, 2013

P4.1: Data Modeling in PowerPivot: Relationships

When we wanted to merge two table together, an option would be to use the VLOOKUP function. To analyze the many tables in a data model, VLOOKUP is inefficient and is replaced with relationships, an 'automatic VLOOKUP', which allows us to link entire tables at a time instead of referencing single columns.

As usual, we will be using the Adventure Works companion material (Chapter 4) from the Ferrari book.


Creating the Data Model


Instead of using VLOOKUP multiple times to add columns into the DimProduct table, we will use relationships to merge all three tables together. Opening the PowerPivot window in Diagram View from the workbook we see that the relationships between the tables have already been formed, because PowerPivot detected existing relationships (will be elaborated in further posts.)


Fig. 1: PowerPivot Diagram View
The arrow lines are representations of relationships in Figure 1. The arrow starts at DimProduct, the source table and points to DimProductSubcategory, the target table, and the connection is finished as DimProductSubcategory is linked to the DimProductCategory table. In the measure field towards the bottom half in grid view of the DimProduct table, we can add a calculated field for the number of products, NumOfProducts


Fig. 2: Creating NumOfProducts Calculated Field
Now we can create a PivotTable tabulating the number of products for each ProductCategory from the DimProduct table. The ProductCategory is actually the EnglishProductCategoryName field in the DimProductCategory table, two relationships away, connected by the ProductSubcategoryKey and the ProductCategoryKey.


Fig. 3: ProductCategory PivotTable
Data models are much more efficient in performance compared to VLOOKUP, especially when dealing with large data sets for computational power, and in multiple tables for a chain of relationships. Also, the NumOfProduct field calculation is available for any PivotTable using the data model, so we do not have to create a new definition every time.

So a data model is a set a tables connected by relationships, sometimes with calculated fields or columns. Simple yet powerful.


Notes on Relationships


Though these relationships will not help much in your love life, the following details on PowerPivot relationships will make your life easier when creating and understanding data models.

Looking at the Diagram View of the tables and relationships, we focus on the relationship arrow from DimProduct to DimProductSubcategory.

  • DimProduct is the source table (the beginning of the relationship)
  • DimProductSubcategory is the target table (where the values relate to source table)
  • ProductSubcategoryKey column is the Foreign Key in source table (contains values which is searched in target table for related row)
  • ProductSubcategoryKey column is the Primary Key in the target table (needs to have unique values in each row)

These are shown highlighted in blue below:


Fig. 4: DimProduct and DimProductSubcategory Relationship
A specific product can only have one subcategory, whereas a subcategory may have many products. That is why the target table (DimProductSubcategory) must have an unique Primary Key (ProductSubcategory) for the products in the DimProduct table. This type of relationship is called "one-to-many", with the target table being "one side", and the source table being the "many side" of the relationship.

We can test the relationship by recreating it. Click the arrow and press Delete. Then in the Design tab, click Create Relationship.


Fig. 5: Creating a Relationship
In the drop-down boxes, we would want to specify the DimProduct and DimProductSubcategory as tables, with the ProductSubcategoryKey as columns from both. However, if we accidentally flip the tables, and confuse the "one-to-many" to "many-to-one" tables, PowerPivot automatically detects the columns in the tables and lets us know it will create the relationship in the opposite direction.

So now you know the inner workings of relationships in data models. Some DAX functions work only when invoked on the correct side of a relationship, so sides do matter. Stay tuned for more on data modeling!


Thanks for reading,

Wayne