Hello Readers!
Today we will be looking at homicide html data in Baltimore from the Baltimore Sun's very own Sun Data Desk. I will demonstrate the power of regular expressions in extracting data, especially from structured data sets, like html through R.
Text, Lots of Text
Text is everywhere around us, especially on the internet. With new social media outlets such as Facebook and Twitter, being able to analyze the posts and tweets by users will provide an informative source of data. So we turn to the Baltimore Sun. Pulling the html from the Baltimore Sun site with each homicide since 2007, we see a massive wall of text:
 |
| Fig. 1: Homicide html text |
How can anyone discern any information encoded in this raw html? Luckily, there is an easier way to read the data: using regular expressions to pull out specific segments of text into an organized template, whether it be a table, data.frame, etc. Regular expression syntax designates and finds the the desired text segments in the html so that we can manipulate the data more coherently.
Let us begin with some examples in R to demonstrate how we can use regular expressions to clean and analyze the raw data.
1. Causes of each Homicide
With all this data about homicides in Baltimore since 2007, it would useful to start with the causes of each homicide, as exploratory analysis. So I will now create a table with counts for each cause.
The information for each homicide case is on its own line. I read in the data using the readLines function into a data.frame d, and use head of d to print the first six cases.
 |
| Fig. 2: Reading in the Data using readLines |
We can see that the cause is surrounded by html tags '<dd>' and '</dd>', with 'Cause:' preceding the actual cause. This information will be useful for the regular expression. For the crucial part, I use the regexec function to pull out the position of the specific string segment in each line that is required.
 |
| Fig. 3: regexec Function |
The brackets in [C|c]ause allows either upper or lower case matching of the word. The actual cause is denoted by (.*?), which pulls any character ".", any number of times "*". However, the * has greedy behavior so it will extract the longest possible match- the last </dd> that it can find, but we only want it to match the </dd> immediately following the actual cause so ? restricts *. So the output of regexec is a list of positions matched by the regular expression. the first set is the beginning position of the entire <dd>[C|c]ause: (.*?)</dd> (246 for the first member of all), whereas the second number (257) is the starting point of the string in the parenthesis.
The second member of all represents the match length of the string from the starting point. It is 24 for the first element and 8 for the second match, and it is logical that the second is shorter because it was inside the larger matched string segment (just the actual cause, and not the Cause: from <dd> to </dd>.) Confusing? (Take a look at Figure 4.) This is verified below with the regmatches function.
 |
| Fig. 4: regmatches Function |
Using the indexes from list all, the regmatches function will match and extract the strings with the information on the starting position and length of the match. We see in Figure 4 that we get a list, match. The regular expression we used in regexec matched the strings found in Figure 4 (the first six shown.) There are two strings: first the entire match enclosed by the html tags <dd> and </dd>, then the actual cause in the parenthesis.
Now this match list can be used to count the number of each type of homicide. However, we just want to extract the strings in the second set of each member in the match list, which contain just the actual cause (blunt force, shooting, etc.), and not the entire matched string with html tags. So we use sapply to slice only the second list member (x[2]) into the causes vector.
 |
| Fig. 5: sapply Function |
Here we have the causes character vector with all the strings of the causes of homicides. We could now do table(causes), but there are some actual causes which were input capitalized so we need to include them as the same cause even if they are spelled differently, using the tolower function.
 |
| Fig. 6: tolower Function and Table of Causes |
So now we can count the number of each cause of homicide, as shown in Figure 6. Shooting was the highest cause of homicide death, at 1,263 counts, and asphyxiation was the lowest specific cause at 31, with 13 unknown counts.
2. Age Distribution of Victims
Next, we can analyze the age distribution of victims to see how old the victims were at the time of homicide. After reading in the data from analyzing causes in the above example, we look at age, specifically the number before "years old", as shown below (Figure 7) for the first line.
 |
| Fig. 7: First Line, Age 17 years old |
Though the age is usually 2 digits, it could be one digit in a child homicide, for which we need to account. So our regular expression would be:
 |
| Fig. 8: Indexes from the regexec Function for age |
The "0-9" in the bracket designates any digit in that range, repeated at least once "+", in parenthesis. Then the years could be spelled either year or year, given by the "|", and the whole expression is bound by the <dd> and </dd> html tags.
The output of years first gives the start position of the match (160) then the corresponding match length (17), followed by the segments in parenthesis. So the digits match begin at 160, and continue for 2 characters, then the spellings of the years follows at position 163 for 5 units.
These positions are matched with the data with regmatches to return the strings shown in Figure 9.
 |
| Fig. 9: String Matches with the regmatches Function |
This confirms that the regular expression retrieved and matched the desired strings in the data. We specifically want the data in the second member, the age in numbers ("17" in Figure 9.) So again, we use sapply to extract the ages from the age list. The ifelse function ensures that the match we are extracting is present and not blank (length > 0.)
 |
| Fig. 10: Using sapply function to extract desired string |
Next we need to coerce the age list to a numeric vector with as.numeric. To confirm, the first six age numbers of the new age vector are shown above in Figure 10, with the first age as the expected 17.
Now we can create a histogram to plot the age distributions from the age vector with:
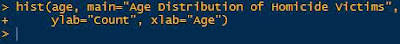 |
| Fig. 11: Creating a Histogram |
Which outputs the histogram below:
 |
| Fig. 11: Age Distribution of Homicide Victims |
Note that the victims were predominately younger than 40 (median age was 27), especially from 20 to 30 years old. I will post more analysis using this Baltimore Homicide data extracted from the html later.
Thanks for reading,
Wayne


No comments:
Post a Comment