Today we will discuss normalization and denormalization of tables in data models. As usual, we will being using the companion material from the Ferrari book. We will be continuing on the data model from the previous post. Let us get started.
Normalization
In the previous post we discussed relationships between tables in the data model with products, product categories, and product subcategories. That particular data model is considered to be normalized. What does it mean to be normalized? Instead of having one detailed table with all the category and subcategory information for each product, the category and subcategory information is referenced in their own tables. This way, the categories and subcategories are not repeated multiple times with each product and allow for efficient data storage. Normalization increases the number of tables, but decreases the overall size of the database by removing redundancies.
 |
| Fig. 1: Normalized Product Data Model |
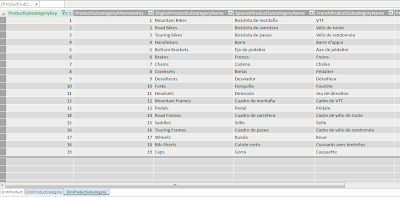
Inside the DimProduct table, instead of a product subcategory column listing the subcategories, it has numbers referencing the DimProductSubcategory table. Below in Figure 2, we see that the subcategories are only listed once (which is why the ProductSubcategoryKey column must be an unique Primary Key.) This reduces redundancy of listing the each subcategory multiple times for the products in the DimProduct table.
 |
| Fig. 2: DimProductSubcategory Table |
Although another table (DimProductSubcategory) was created by normalizing, it occupies less overall physical hard drive space. However, viewing the product data model information as a set of normalized tables from the user perspective is difficult and not logical. Once a database is normalized for storage, the required data must be denormalized for readability when retrieved to be analyzed.
Denormalizing (Reducing Normalization)
For this product data model, we can easily create calculated columns for the product categories and subcategories in the product table and hide the product category and subcategory tables in the model. This would reduce the normalization, thus increasing the complexity and physical storage size of the product table.
In the DimProduct table in PowerPivot, create a calculated column for the ProductCategory using the DAX expression:
=RELATED(DimProductCategory[EnglishProductName])
as shown below:
 |
| Fig. 3: RELATED DAX Expression for ProductCategory |
=RELATED(DimProductSubcategory[EnglishProductSubcategoryName])
again, shown below:
 |
| Fig. 4: RELATED DAX Expression for ProductSubcategory |
Now the DimProduct table has decreased normalization and more redundancy, with product categories and subcategories being repeated multiple times, but is more readable for the user. To finish, we can hide the other two tables which are now not required since the relevant data is in our desired product table.
To hide the DimProductCategory and DimProductSubcategory tables, in the PowerPivot Diagram View, right-click the table and select Hide from Client Tools. Normalized tables which are needed for the data model, but can be safely hidden are called technical tables.
 |
| Fig. 5: Hide from Client Tools, Table |
Additionally, the ProductSubcategoryKey, as the Foreign Key in the DimProduct table, is now not required because the table has been denormalized with the actual subcategory column in the table. Yes, it can be hidden too (along with ProductKey and ProductAlternateKey.)
 |
| Fig. 6: Hide from Client Tools, Column |
Hiding technical tables and technical columns, as well as removing normalization are important steps to improving the usability of a data model. Though relational databases use normalization, denormalized tables offer ease for analysis and querying, while a normalized data model removes redundancy, occupies less disk space, and improves database operational performance.
Either option can be right or wrong depending on the scenario, and the operations we would like to perform on it. In the next post, I will discuss denormalizing with SQL queries.
Thanks for reading,
Wayne
No comments:
Post a Comment