Hello Readers,
Today we turn to tweet analysis in our Text Mining Series, as the last text mining post discussed term analysis. Instead of looking at how each individual word, or terms in each tweet relate to each other, we will visualize tweets as a whole and how they relate to each other based on their term similarity.
We will continue to use the #Ukraine tweets queried in the K-Medoids clustering post. You can following along with whatever trending twitteR query you prefer. Here we will go from a term-document matrix to a network object. Start R and let us get started.
#Ukraine Tweets as a Network
There were certain key terms in the tweets that connected the #Ukraine tweets together. Removing them would improve our ability to see underlying connections (besides the obvious), and simplify the network graph. So here I chose to remove "ukraine", "prorussian", and "russia".
You might remember last time to create an adjacency matrix for the terms, we multiplied the term-document matrix and its transpose together. Here we will perform the same matrix multiplication but in a different order, to create an adjacency matrix for the tweets (documents). This time we require the transpose of the tweet matrix multiplied by the tweet matrix, so that the tweets (docs) are multiplied together.
Tweet Adjacency Matrix Code:
# Tweet Network Analysis ####
load("ukraine.tdm.RData")

# remove common terms to simplify graph and find
# relationships between tweets beyond keywords
ukraine.m <- as.matrix(ukraine.tdm)
idx <- which(dimnames(ukraine.m)$Terms %in% c("ukraine", "prorussian", "russia"))
ukraine.tweetm <- ukraine.m[-idx,]

# build tweet-tweet adjacency matrix
ukraine.tweetm <- t(ukraine.tweetm) %*% ukraine.tweetm
ukraine.tweetm[5:10,5:10]

    Docs
Docs 5 6 7 8 9 10
  5  0 0 0 0 0  0
  6  0 2 0 0 1  0
  7  0 0 1 0 0  0
  8  0 0 0 0 0  0
  9  0 1 0 0 4  0
  10 0 0 0 0 0  0
We see from the tweet adjacency matrix, the terms two documents have in common. For example, tweet 9 has 1 term in common with tweet 6. The number will be the same whether you start at tweet 9 or tweet 6, and compare the other.
Now we are ready for plotting the network graphic.
Visualizing the Network
Again we will use the igraph library in R, and use the graph.adjacency() function to create the network graph object. Recall that V( ) allows us to manipulate the vertices and E() allows us to format the edges. Below we change and set the labels, color, and size for the vertices.
Tweet Network Setup Code:
# configure plot
library(igraph)
ukraine.g <- graph.adjacency(ukraine.tweetm, weighted=TRUE, mode="undirected")
V(ukraine.g)$degree <- degree(ukraine.g)
ukraine.g <- simplify(ukraine.g)

# set labels of vertices to tweet IDs
V(ukraine.g)$label <- V(ukraine.g)$name
V(ukraine.g)$label.cex <- 1
V(ukraine.g)$color <- rgb(.4, 0, 0, .7)
V(ukraine.g)$size <- 2
V(ukraine.g)$frame.color <- NA

# barplot of connections
barplot(table(V(ukraine.g)$degree), main="Number of Adjacent Edges")
 |
| Barplot of Number of Connections |
From the barplot, we see that there are over 60 tweets which do not share any edges with other tweets. For the most connections, there is 1 tweet with 59 connections. The median connection number is 16.
Next we modify the the graph object even more by accenting the vertices with zero degrees selected by index in the idx variable.. In order to understand the content of those isolated tweets, we pull the first 20 characters of tweet text from the raw tweet data (you can specify how many you want).
Then we change the color and width of the edges to reflect a scale of the minimum and maximum weights (width/strength of the connections). This way we can discern the size of the weight relative to the maximum weight. Then we plot the tweet network graphic.
Plotting Code:
# set vertex colors based on degree
idx <- V(ukraine.g)$degree == 0
V(ukraine.g)$label.color[idx] <- rgb(0,0,.3,.7)
# load raw twitter text
library(twitteR)
load("ukraine.raw.RData")
# convert tweets to data.frame
ukraine.df <- do.call("rbind", lapply(ukraine, as.data.frame))
# set labels to the IDs and the first 20 characters of tweets
V(ukraine.g)$label[idx] <- paste(V(ukraine.g)$name[idx],
                                 substr(ukraine.df$text[idx], 1, 20),
                                 sep=": ")
egam <- (log(E(ukraine.g)$weight)+.2) / max(log(E(ukraine.g)$weight)+.2)
E(ukraine.g)$color <- rgb(.5, .5, 0, egam)
E(ukraine.g)$width <- egam
layout2 <- layout.fruchterman.reingold(ukraine.g)
plot(ukraine.g, layout2)
 |
| Initial Tweet Network Graphic |
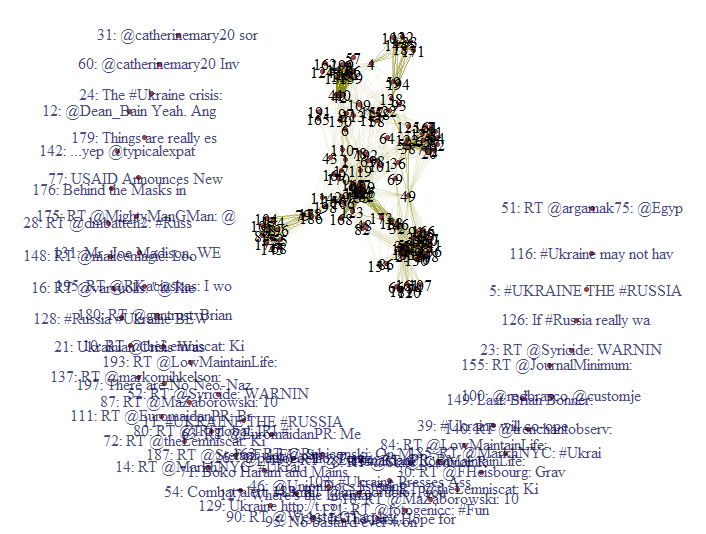
The first 20 characters of tweets with no degrees in blue surround the network of interconnected tweets. Looking at this cumbersome graphic, I would like to eliminate the zero degree tweets so we can look at the connected tweets.
Revised Plotting Code:
# delete vertices in crescent with no degrees
# remove from graph using delete.vertices()
ukraine.g2 <- delete.vertices(ukraine.g,
                              V(ukraine.g)[degree(ukraine.g)==0])
plot(ukraine.g2, layout=layout.fruchterman.reingold)
 |
| Tweet Network Graphic- Removed Unconnected Vertices |
Now with the degree-less tweets removed, we can get a better view of the tweet network. Additionally, we can delete the edges with low weights to accentuate the connections with heavier weights.
Revised Again Plotting Code:
# remove edges with low degrees
ukraine.g3 <- delete.edges(ukraine.g,
                           E(ukraine.g)[E(ukraine.g)$weights <= 1])
ukraine.g3 <- delete.vertices(ukraine.g3,
                              V(ukraine.g3)[degree(ukraine.g3)==0])
plot(ukraine.g3, layout=layout.fruchterman.reingold)
 |
| Tweet Network Graphic- Removed Low Degree Tweets |
The new tweet network graphic is much more manageable than the first two graphics, which included the zero degree tweets, and edges with low weight. We can observe a few close tweet clusters- at least six.
Tweet Clusters
Since we now have our visual of tweets, and see how they cluster together with various weights, we would like to read the tweets. For example, let us explore the cluster in the very top right of the graphic, consisting of text numbers 105, 177, 145, 152, 68, 89, 88, 55, 104, 174, and 196.
Code:
# check tweet cluster texts
ukraine.df$text[c(105,177,145,152,68,89,88,55,104,174,196)]

 [1] "@ericmargolis Is Russia or the US respecting the sovereignty and territorial integrity of #Ukraine as per the 1994 Budapest Memorandum????"
 [2] "Troops on the Ground: U.S. and NATO Plan PSYOPS Teams in #Ukraine - http://t.co/pXP3TR0uwi #LNYHBT #TEAPARTY #WAAR #REDNATION #CCOT #TCOT"
 [3] "US condemns ‘unacceptable’ Ukraine violence http://t.co/OcAClP01sF #Ukraine #Russia #USA #USAOutOfUkraine #MaidanDictatorship #Terrorism"
 [4] ".@Rubiconski  Apparently there's a treaty w US that if #Ukraine got rid of nukes, US would protect them."
 [5] "Unsurprisingly no one has made a comparison to #stalin about #dissidents losing native status in #ukraine. http://t.co/OylSNE6vAi #OSCE #US"
 [6] "RT @Yes2Pot: .@Rubiconski  Apparently there's a treaty w US that if #Ukraine got rid of nukes, US would protect them."
 [7] "Ukraine violence reaches deadliest point as Russia calls on U.S. for help #Ukraine. http://t.co/CqvVmkiltR http://t.co/OMQ8Cx6tOO"
 [8] "RT @cachu: Ukrainian passports to Polish #mercenaries to fight against UKRAINIANS   - http://t.co/Z1IoX051Jo… #Poland #Ukraine #Russia #US …"
 [9] "More U.S. #Sanctions Pledged Should #Ukraine Crisis Persist: The U.S. may impose… http://t.co/pF77x4GzLh"
 [10] "RT @MDFoundation: LNG exports from the U.S. can make Ukraine and even Europe more independent http://t.co/hQmNB5V93R #LNG #Ukraine #Russia …"
 [11] "#Ukraine to Dominate Merkel's U.S. Visit - The Ukraine crisis—and the role of further potential... http://t.co/rwnHqoduFR\n #EuropeanUnion"
What a wall of text! So these 11 tweets have many terms in common with each other with the common terms removed. Although they all have to do with #Ukraine, the topics vary from Merkel's visit in tweet 11, to the 1994 Budapest Memorandum in tweet 1, and NATO in tweet 2. You can go ahead and check the other clusters in your tweet network for text content.
So there we go, we have our tweet network visualization (as opposed to term network), and we can view specific tweets that we located through the visualization. Stay tuned for more R posts!
Thanks for reading,
Wayne
@beyondvalence
Hi Wayne, I am trying to connect with you regarding your tutorials on text mining in R. Are you planning to post tutorials on advanced sentiment analysis or opinion mining?
ReplyDeleteWhat is the best way to connect with you? I am running a forum on data mining. If you are interested, we can work on a collaborative project.
Best Regards
Fahim
Great Article it its really informative and innovative keep here: with new updates. Its was really valuable. Thanks a lot. тренинговый портал
ReplyDeleteBolavita Agen Sabung Ayam Live Online nomor satu di indonesia !
ReplyDeletedi www.bolavita.site Minimal Deposit hanya 50ribu saja untuk kamu yang ingin ikut Pasang Taruhan langsung secara Online !
Dan Di Bolavita kamu juga bisa menikmati Bonus deposit pertama kamu sebesar 10% !
Informasi Selengkapnya Hubungi Cs kami yang bertugas :
WA : +62812-2222-995
BBM : BOLAVITA
Aplikasi Live Chat Playstore / App Store : BOLAVITA Sabung Ayam