Hello Readers,
Today we will visualize influenza trends in the United States, captured from Google.org Flu Trends. By combining flu symptom search queries with CDC flu data, Google was able to estimate how many of those searching for flu symptoms actually had the flu, or had influenza like illness (ILI). Locations are determined from IP addresses via their server logs.

Above is a plot of the average percentage of influenza like illness among the 50 states. We will look at weekly time series data for each 50 states from Google Flu Trends from June of 2003 to October of 2013. Click here for the text file.
Load the ggplot2, scales libraries in R, and let us get started.
Flu Data
After reading in the "us-historic-v2mod.txt" as a CSV file, we call head() and check what we have:
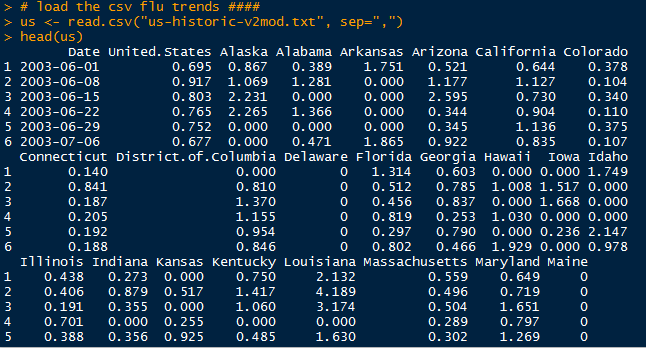 |
| Raw Data |
Our data set contains 541 observations in time with 160 variables of U.S. average, states, cities, and regions. We isolate the state variables along with the date into a new data.frame, and convert the Date column into a "year-month-day" date format.
 |
| New Data.Frame with States |
Because we want to use ggplot() to display the flu trend for each of the 50 states, we have to create a new data.frame will all flu trend data in one column and the state in another. Essentially, we have to row bind all data from 50 states together.
 |
| Data.Frame Conversion |
After we generated a Date, Flu, and State columns, we can column bind them together. However, make sure to use cbind.data.frame() instead of regular cbind() to preserve the date format.
 |
| Converted Data.Frame |
Now we are ready for plotting the flu data.
Visualization of the Flu Data
Earlier I mentioned to load the ggplot2 and scales libraries. Next, we use the ggplot() function to begin our plot. The key to plotting 50 trends lies in the facet_wrap() function, where we stratify or 'facet' the State variable, and specify the number of columns and rows to display. Note that the State variable is a factor. The scale_x_date() function allows us to customize the x axis display to show the last 2 digits of every year ("%y").
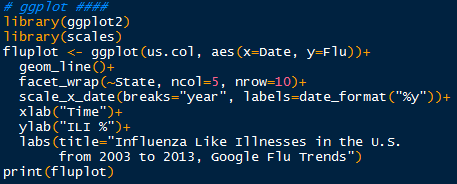 |
| Plot Code |
Pass the fluplot through print() and we obtain the plot below:

That is quite a lot of data to process visually at one time. After scanning the plot, we observe that the fluctuation in some states, such as Wyoming, Utah, or Florida, are not as prominent as other states- New Mexico, Arkansas, or Oklahoma. Some of these differences could be attributed to state population.
However, almost every state at the start of a new year has a peak or increase in influenza like illness. The majority of states have higher peaks in 2003-2004, and 2009-2010. Recall the H1N1 incident from 2009-2010, where influenza of swine origin with novel viral genes threatened a pandemic. Due to the vigilance of the CDC, state and local health departments, hospitals, and healthcare personnel, quick vaccine creation and high vaccination levels prevented H1N1 from reaching pandemic distribution.
Yes, these flu data are time series, so we will be able to decompose them and predict future ILI percentages! So stay tuned for more posts!
Thanks for reading,
Wayne
@beyondvalence
It is really a great work and the way in which you are sharing the knowledge is excellent.Thanks for your informative article
ReplyDeleteData Science Online Training|
R Programming Online Training|
Hadoop Online Training
Good Post! Thank you so much for sharing this pretty post, it was so good to read and useful to improve my knowledge as updated one, keep blogging…
ReplyDeleteHadoop Training in Marathahalli|
Hadoop Training in Bangalore|
Data science training in Marathahalli|
Data science training in Bangalore|
Dapatkan Pasaran Bola Terbaik di Situs Agen Resmi BOLAVITA !
ReplyDeletewww.bolavita.site Agen Taruhan Bola Online yang sudah di percaya dan sudah berdiri sangat lama di dunia perrjudiian Indonesia !
Aman dan Terpercaya !
Hubungi Cs kami yang bertugas 24 jam Online :
BBM: BOLAVITA
WA: +6281377055002
Atau bisa langsung download Aplikasi Resmi BOLAVITA :
Aplikasi Playstore : Bolavita Sabung Ayam
nice post.r programming training
ReplyDeleter programming online training