Hello Readers,
One of the most utilized methods in obtaining GIS data in Python is through URL and FTP connections. This post will demonstrate reading file data from the U.S. Geological Survey (USGS) and the National Oceanic and Atmospheric Administration (NOAA).
URL
The Uniform Resource Locator enables web browsers and programs to locate resources. We will use the urllib module to access the file, "hancock.zip", from the Google code website. After opening the Python Interpreter, or writing a script, import the urllib module, and assign the URL and file name to variables. After retrieving the file, Python will print out confirmation:
 |
| Retrieving hancock.zip |
Now we turn to the USGS, and we want to read in US earthquake data from the past hour into Python. We use the urlopen() method to establish the connection. Using readline() to parse and print each line in the CSV file, we can see the first line includes the column headers, and the second line describes an earthquake near The Geysers in California. It appears to be small in magnitude at 0.7.
 |
| Reading Earthquake Data |
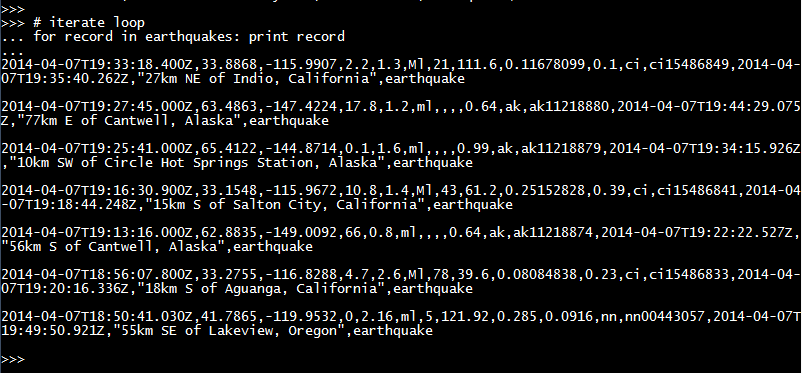
Of course we can loop through the rest of the lines with a for loop:
 |
| More Earthquake Data |
As we can see, the recently reported earthquakes all happened in the Western U.S.- Alaska, California, and Oregon.
FTP
The File Transfer Protocol allows file transfers between hosts over a TCP network. We can access NOAA's ftp server using the ftplib module to retrieve a specific file about tidal data. After specifying the server, we can connect to it, which requires no login information (anonymous). We change the directory and write the file in binary ("wb").
We look for a specific line concerning the location in latitude and longitude of this particular tidal buoy in the for loop. (It is located off the coast of Alaska- 50N, 171.8W)
 |
| Retrieving Tides Data via FTP |
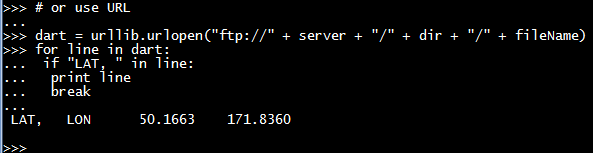
Likewise, we can approach this retrieval process using the urllib module as well. Since we can locate the tidal text file on the NOAA ftp server, we simply use "ftp://" as the URL protocol.
 |
| Retrieving Tides Data via URL |
After running the same loop, we arrive with the same latitude and longitude.
And there we have it, folks! Two ways of retrieving and reading data from online resources through Python- yes, pure Python. Here we retrieved shapefiles from hancock.zip, earthquake data from USGS, and tidal buoy data from NOAA. Stay tuned for more posts!
Thanks for reading,
Wayne
@beyondvalence
Code:
# Python GIS URL FTP


# URL
import urllib

# access hancock shapefiles
url = "https://geospatialpython.googlecode.com/files/hancock.zip"
fileName = "hancock.zip"
urllib.urlretrieve(url, fileName)
print("\n Saved Hancock file \n")
# hancock.zip is saved to current working directory

# access earthquake data from USGS
url = "http://earthquake.usgs.gov/earthquakes/feed/v1.0/summary/all_hour.csv"
earthquakes = urllib.urlopen(url)
print("reading earthquake lines \n")
print(earthquakes.readline() + "\n")
print(earthquakes.readline() + "\n")

# iterate loop
print("looping earthquake data \n")
for record in earthquakes: print record

# FTP
import ftplib

server = "ftp.ngdc.noaa.gov"
dir = "hazards/DART/20070815_peru"
fileName = "21415_from_20070727_08_55_15_tides.txt"
ftp = ftplib.FTP(server)
ftp.login()
ftp.cwd(dir)
out = open(fileName, "wb")
ftp.retrbinary("RETR " + fileName, out.write)
out.close()
dart = open(fileName)
print("dart \n")
for line in dart:
    if "LAT, " in line:
        print line
        break

print ("dart URL \n")
# or use URL
dart = urllib.urlopen("ftp://" + server + "/" + dir + "/" + fileName)
for line in dart:
    if "LAT, " in line:
        print line
        break

#
print("done")


