Loading...
Showing posts with label calculated fields. Show all posts

Friday, August 23, 2013

P3.2: Beginning DAX 2

And we are back again for more DAX! This post is a continuation in the understanding DAX series (link to P3.1.) Here we will gain a deeper understanding of calculated columns and fields (introduced in P2.2) from a DAX perspective.


Understanding Calculated Columns & Fields

Calculated columns and calculated fields are actually quite different despite initial similarities. Here we will explore the differences of columns of fields, while gaining DAX concepts and syntax.


Calculated Columns

Before in P2.2, we touched upon the notion of creating a calculated column and a calculated field. By clicking the Add Column button on the Design tab, we can create a calculated column in PowerPivot. It is versatile in PivotTables; also the DAX expression for the column applies to the current row of the table. When we reference a column, it returns the value of that particular column in that specific row.


Fig. 1: Add Column Button
Note:
There are DAX functions which aggregate the values of a column for a whole table. To evaluate a subset of rows, we use DAX to specify a range of rows or a single value from another row and operate on that subset table. Essentially we can restrict rows and apply filters so the desired rows are selected for computation.


Calculated Fields

Now for something a little different. While calculated fields use the same DAX syntax as calculated columns, calculated fields evaluate the expression at the context of the cell of the PivotTable, not at the row level of the PowerPivot table like a calculated column.


Fig. 2: Calculated Fields Button
Which is why we arrived at a wrong result when we tried to calculate the gross margin as a percentage of the sales as a calculated column. In fact, PowerPivot calculated the gross margin percentage for each row using that method. What we wanted was to divide the gross margin by the sales within the context (column and row designation) of the PivotTable; we did not want each percentage in each row added, we required the gross margin percentage of the total (in say, Year 2006.)

So if we used the regular formula to calculate a field, we could get the following error:


Fig. 3: Calculated Field Error Using the Same DAX Expression as Calculating a Column
That is because the GrossMargin column has a different value in each row, and we would rather see the aggregate of the GrossMargin divided by the aggregate SalesAmount for each cell context in the PivotTable.

The correct method was to type in the sum of each:
=SUM(Sales[GrossMargin]) / SUM(Sales[SalesAmount])
and then divide them, as shown in Figure 4.


Fig. 4: Using the SUM for the Correct Calculated GrossMarginPct Field (See: No Errors!)
By using this approach, in the PivotTable, the column and row would have the labels as the context for the cells involved. So when it goes to take the SUM of the GrossMargin and the SUM of the SalesAmount, this specific PivotTable takes the SUM for a certain Year context, and summing values in the DAX expression, say for 2007. The PivotTable with GrossMarginPct added is shown below.


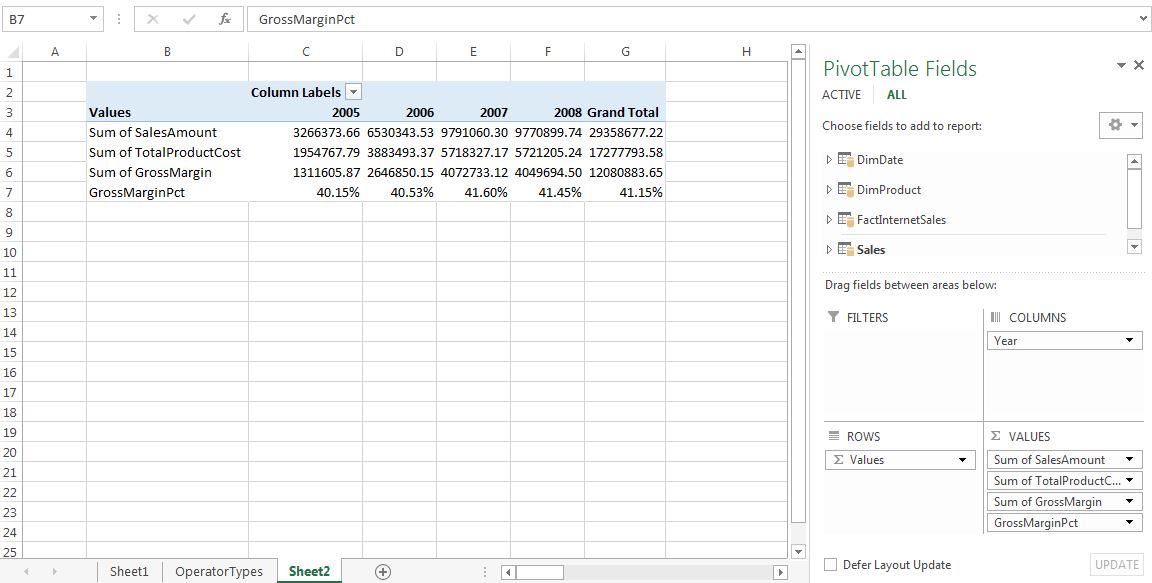
Fig. 5: PivotTable with GrossMarginPct


When to Use Calculated Columns and Measures (Fields)

So when do we use a calculated column and in other cases, a calculated field (or measure)? (When do we get to eat Jell-O?) In most situations, it would depend on the computation of choice. For example, there are several situations to use calculated columns:

  • When we want to evaluate an expression which is confined to the current row,
  • The results will be displayed in the columns or rows of the PivotTable, and not the values,
  • Or when we categorize text or numbers (categorical variables)

Situations where we would use calculated fields occur when we would like to display the results in the PivotTable Values section. Each cell in the Values section will change based on the context of the rows and columns in the PivotTable selections. If we changed the rows in Figure 5 to include the ModelName, then the calculationed field would reflect the change, and show the GrossMarginPct stratified by ModelName (Figure 6).


Fig. 6: PivotTable with ModelName Stratifying the Calculated Field


Cross-Referencing

We can use calculated columns in our DAX expressions when creating calculated fields. Also, the reverse can be done as well. However counter-intuitive, a calculated column can reference calculated fields, and this confines the calculated field to the context of the current row. Therefore, the calculated field transforms into a calculated column, and will not be influenced by user changes in context on the PivotTable.


Here we have explored the similarities and (for the most part) differences between calculated columns and fields through DAX. Understanding these concepts are important in becoming proficient at DAX, as well being able to manipulate data efficiently.


Thanks for reading,

Wayne

Saturday, August 17, 2013

P2.2: Creating Calculated Columns and Calculated Fields in PowerPivot

This post will explore calculated columns and fields in PowerPivot, using the sample database from the Ferrari PowerPivot book. We will continue to use the PivotTable and data model from the previous post.


Creating a Calculated Column

From the previous post, we created a PivotTable depicting the SalesAmount by Color, and CalendarYear


Fig. 1: SalesAmount by Color by CalendarYear PivotTable
To understand the profitability from the sales, we account at least for the product cost as well. So the TotalProductCost column needs to be added from the FactInternetSales table.


Fig. 2: SalesAmount with TotalProductCost PivotTable

The TotalProductCost column was added beside each SalesAmount column in the PivotTable shown in Figure 2. For certain reports arranging columns side by side is better, but for readability for this report, we could like to position the fields in rows resembling the subtraction to obtain the profit data. So drag the Σ Values to the Rows area, as in Figure 3.

Fig. 3: Dragging the Σ Values to Rows Area
The PivotTable is now easier to read and set up for the calculated column.

Fig. 4: Revised SalesAmount and TotalProductCost PivotTable
The FactInternetSales table has no gross margin column, which is the difference between SalesAmount and TotalProductCost. So we will add a column called GrossMargin in PowerPivot as a calculated column, which extends the content of a table and is stored in the data model. First, navigate to the FactInternetSales table in the PowerPivot window. In the Design tab, click the Add button which will add a new column to the end of the table.

Fig. 5: Add Column Button
Now we use simple DAX language to calculate the GrossMargin column. Though DAX syntax can be more intensive, the formula is very straight forward. Type in:
= FactInternetSales[SalesAmount] - FactInternetSales[TotalProductCost]
as shown in the Figure 6 below. It subtracts the TotalProductCost from the SalesAmount for the GrossMargin column, and it is now in the data model. The column can be renamed by right-clicking the column header and selecting Rename Column.

Fig. 6: GrossMargin Formula
Let us add the GrossMargin column to the Values area in the PivotTable. We can find it in the FactInternetSales table where we created it in PowerPivot. It would go in the Values area.

Fig. 7: PivotTable with GrossMargin
We can use DAX to solve more complex calculations, which we will explore in future posts. However with this simple DAX formula we have created a calculated column and displayed it on the PivotTable.


Creating a Calculated Field

A calculated field, also known as measures, are computed at an aggregate level, compared to calculated columns, which are computed for every row. For example, let us compute the gross margin as a percentage of the total sales amount.

Add a new column in PowerPivot to the FactInternetSales table which calculates the gross margin percentage. We might enter this as the formula for GrossMarginPct:
=FactInternetSales[GrossMargin] / FactInternetSales[SalesAmount]
Fig. 8: Formula for GrossMarginPct
Then display the resulting GrossMarginPct in the PivotTable under the Values area.

Fig. 9: PivotTable Including GrossMarginPct
Wait! The GrossMarginPct numbers look quite large and not right at all. In fact, the formula took the summation of all the percentages and displayed the sum, which is not what we wanted (this is the incorrect way to formulate this GrossMarginPct calculated field.) We can remove the GrossMarginPct from the PivotTable.

The correct way to obtain the GrossMargin percentage as a calculated field is to click on the Calculated Fields button in the PowerPivot tab.

Fig. 10: Calculated Fields Button
Name the new field GrossMargin%, and for the formula, type in:
=SUM(FactInternetSales[GrossMargin]) / SUM(FactInternetSales[SalesAmount])
as shown down below.

Fig. 11: Creating the GrossMargin% Field
The syntax for the calculated field is similar to the calculated column formula; it just has an additional SUM function. This will be explained in later posts describing the DAX language. In the window, we are given options at the bottom to format the output of the calculation, and since it is a percentage, select the Percentage format. After we click OK, the calculated field, GrossMargin%, is added to the data model and is available to complete the PivotTable. Select it and confirm that it is in the Values area.

Fig. 12: Revised PivotTable with GrossMargin%
Now these percentages look much more reasonable than the previous gross margin calculation, because it took the aggregate of the SalesAmount and the TotalProductionCost. We take a deeper look at calculated columns and fields later in P3.2.

Note:

The calculated field will be available to the PivotTable or report that we create using the data model. Think of it like this: we are building a data model, not just a report. The data model can be used for many other different reports or PivotTables, so as we transition into a good data modeler, we become better report creators.


Thanks for reading,
Wayne