Loading...
Showing posts with label data market. Show all posts

Thursday, March 20, 2014

How Fast is Fast? Comparing U.S. and South Korea Broadband Speeds in R


Hello Readers,


You might have heard about Google Fiber, where you browse and stream in the world of blindingly fast internet speed. How fast exactly? 100 times as fast, at 1,000 mbits/s (megabits per second). The rest of us in the United States have to trudge along with an average of 20 mbits/s while downloading, where actual speeds lag in around ~8 mbits/s. Such is the power of the clauses like "speeds up to __".

Unfortunately Google Fiber is only available in select cities (Kansas City, Austin TX, and Provo UT). So if you do not live there or any of these places, you probably will still be streaming Netflix and YouTube at average speed. Bummer. Here is a YouTube video demonstrating Google fiber speeds.

Internationally, the United States is beginning to lag behind other countries in broadband speed (download and upload). Take South Korea for instance. Entering into this millennium, South Korea has built significant networking infrastructure, and South Korean brands such as Samsung and LG have permeated the world electronic stage with high quality products. What Japan accomplished with innovating cars, right now South Korea is doing with electronics. And you guessed it, they also upgraded their broadband infrastructure as their economy focused on high tech in the 1990s. Their download and upload speeds are more than twice that of US counterparts (we generate the below plot in the post). 


S.K. Download Speeds in 2009 > U.S. Download Speeds in 2014

Also, two of South Korea's largest mobile carriers, SK Telecom and LG Uplus Corp, are rolling out a new LTE broadband network in 2014 at 300 megabits per second. Compare that speed to 8 megabits per second here in the U.S. There are many factors involved to make this possible in South Korea, such as high population density of 1,200 people per square mile, and government regulation to bolster competition among service providers. In the U.S., providers have their own closed-network system, so by switching to/from Comcast or Verizon, you would have to install new cables. This infrastructure dilemma acts as a cost barrier for new companies looking to enter into the broadband market.

Enough of the Fiber talk. We are here to discuss average internet broadband speeds for average people. And just because our internet is slower here in the U.S., does not mean that it does not work. Lucky us, there is open data available at Data Market. Let us start R and crunch the data!


Broadband Data


Start here for the exact data set from Data Market. This data is provided by Ookla, an internet metrics company. You most likely have used their speed test utility to measure your internet speed. The data set has many countries from which to select the download and upload speeds including the World average speed in kilobits per second. Make sure the United States and South Korea variables are selected with download and upload speeds before clicking the Export tab and downloading the CSV file.


Data Market- Broadband Speeds CSV

Now that we have downloaded the CSV file, we can import it into R:


Reading in the Broadband CSV Data

Note the columns and their data. There are 5 columns designating the year-month, South Korean download speed, South Korean upload speed, U.S. download speed, and U.S. upload speed, all in kilobits per second. We will be splitting the the last four into individual time series and appending them to a list due to their different lengths (South Korea has less data points). 


Remember to remove the last row in all columns, since it contains just a descriptor of the variables and null values. The creation will result in 4 time series: download and upload speeds for the U.S., and download and upload speeds for South Korea. Take notice that we divide each time series by 1000 to obtain megabits per second from kilobits per second.


Creating Time Series Data.frames and a List Class

The bb (broadband) list allows us to use a shorter input method, and aggregates all the time series into one list object. We could not create a data.frame with all four time series because the South Korea and U.S. series have different number of data points. South Korea data start at September 2008, whereas U.S. data start in January 2008. The bb list contents are shown below:


Time Series in List Contents
Check that the time series are in megabits by comparing the values. They should be three orders of magnitude less.


Plotting Broadband Speeds


Since we have two countries with two time series each, we will prudently use color coding for visual purposes. First we plot the download speed for South Korea in dark green using plot(), making sure to specify custom y and x axis to fit the data for U.S. as well. Next we add the remaining three time series with lines() with upload speed for South Korea in green, and the download and upload speeds for the U.S. in dark orange and orange, respectively.


Broadband Time Series Plot Code

Lastly we add a legend with the label and colors to yield our plot below:


Broadband Plot

And look at those colors! We can observe the South Korean green lines after mid 2011 are much higher than the orange yellow lines of the U.S. broadband speeds. In fact, we can see that download speeds in South Korea in 2009 were higher than our download speeds in the U.S. now in 2014


The Future of Broadband?


Of course we would want to know the forecasts of the time series. With our current technologies, how fast would our broadband speeds be in 2 years? Specifically, we want to ballpark our download speeds in the U.S. compared to South Korea. In previous time series posts, we used regression and ARIMA methods to forecast future values for wheat production and Amazon stock prices respectively. To create a prediction, or forecast, we will turn to exponential smoothing for these broadband data.

Exponential smoothing estimates the next time series value using the weighted sums of the past observations. Naturally we want to weight more recent observations more than previous observations. We can use '
a' to set the weight 'lamba':

lambda = a(1-a)^i, where 0 < a < 1
such that xt = a*xt + a(1-a)*xt-1 + a(1-a)^2 * xt-2 + ...

This procedure is called the Holt-Winters procedure, which in R manifests as the HoltWinters() function. This function includes two other smoothing parameters B for trend, and gamma for seasonal variation. In our case, we would simply specify the data and R will use determine the parameters by minimizing the mean squared prediction error, one step at a time.

Let us consider the exponential smoothing over the download speeds of the U.S. and South Korea. The U.S. output is shown below:

Holt-Winters Exponential Smoothing

We can see the
HoltWinters() function determined the three parameters, alpha, beta, and gamma. Next we overlay the fitted values from the HoltWinters() function to the real download speed time series to visualize how they approximate the actual values. The plot code is shown below, with different line colors for visual contrast:


Holt-Winters Plot Code

The resulting plot is displayed below:


Okay, the Holt-Winters procedure did a good job of approximating the the observed time series values, as seen by the red and yellow lines above for estimated U.S. and South Korea download speeds.


Now that we have confirmed the model, we will go ahead and predict the next 2 years of broadband download speeds using the
predict() function passing through the Holt-Winters objects. The predicted values are shown below:


Predicted 2 Years Values from Holt-Winters
We can see the U.S. predicted download speeds approach 28 mbits/s by 2016. For South Korea in 2016, the estimated download speed exceeds 60 mbits/s. Next we plot these predicted values with the download speeds time series with a dashed line type to differentiate the observed and predicted values with lty=2.


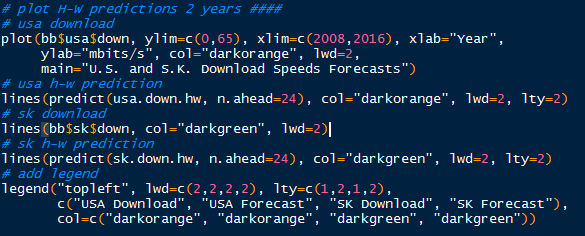
Plotting Predicted 2 Year Values

The prediction plot is depicted below.


Observe the U.S. download speeds with 2 year forecast in orange, and the South Korea download speeds in green. Note the forecasts as dashed lines. We see that the exponential smoothing predicted increases in U.S. and South Korea download speeds, with South Korea download speeds over 60 mbits/s and 28 mbits/s in the U.S.

In case you were curious, I also predicted the future upload speeds 2 years ahead to 2016 as well. U.S. upload speeds predicted by the Holt-Winters procedure barely exceeds 5 mbits/s, while upload speeds in South Korea rises above 55 mbits/s. Both predicted download and upload speeds in South Korea in 2016 are well beyond the broadband speeds in the U.S. The upload speeds plot is shown below:


Hopefully this post gives you guys a better idea of the state of broadband speeds now and after here in the U.S., and what could be possible, namely in South Korea. It is humbling to reiterate again that download speeds in the U.S. now in 2014 have not yet exceeded South Korean download speeds back in 2009. 

We would have to keep an eye out on this Comcast merger with Time Warner Cable. Merged, Comcast would control 40% of broadband market and have 30 million TV subscribers. And if New York allows it, I suspect lukewarm increases in broadband speeds, if at all. Google Fiber, where are you?

Stay tuned for more R posts!


Thanks for reading,

Wayne
@beyondvalence
LinkedIn

Wednesday, March 12, 2014

R: World Wheat Production Part II, Linear Filtering and Regression Forecasting


Hello Readers,


Today we will continue analyzing the wheat production and harvest area data from the Food and Agriculture Organization of the UN. In the previous post, we imported the data from Data Market and proceeded to plot the production quantity and harvest area time series, reproduced below:


With the wheat production increasing more than the harvest area over the years, we also plotted histograms to track the lag of the log of wheat production. We noted that the mean difference were, as expected, above zero.

Next we move on to model the time series single component of trend in the wheat production in R. We will not focus on the Harvest Area series because it does not fluctuate like the Production Quantity series, as seen above. Let us get started.


Linear Filtering


Now that we have a good grasp on the wheat data, we can model the time series to find a trend. A time series is usually decomposed into multiple components: a trend, a seasonal component, and a remainder component. One method to accomplish trend discovery is by using linear filtering with moving averages and equal weights. Each element of the time series X is filtered through average a, such that X-a to Xa are multiplied by coefficients (1/(2a+1)). For example, with a filter of a=2, for an element Xn, sum of the previous two and next 2 elements and Xn, are divided by 1/5, as 1/(2*2+1).


In R, we model the trend component with the filter() function, and specify the coefficients. This allows us to plot the trend with different moving averages of 2 and 10 over the wheat production quantity time series.

Plotting Wheat Production with Moving Averages
Below, we can observe the moving averages of 2 and 10 overlaying the Production Quantity time series.


Note that the red moving average 2 trend line more closely follows the fluctuations of the time series than the green average 10. Why? Because the moving average = 10 takes the average of the last and next 10 for that series element. 


So the green trend line incorporates more values in calculating the moving average (a=10, n is 21; a=2, n is 5) than the red trend line. Therefore green trend line is smoother and depicts a trend covering a longer time frame than the red trend line, which shows the average over a shorter time frame, thus fluctuating more with the wheat production data.


Time Series Decomposition


Now that we have covered the trend component, we turn to the next component, seasonal. The seasonal component attempts to capture the variation within a time frame, usually a year- so that the fluctuations between the seasons or quarters, are captured. However, for our wheat data, we only have yearly measures in the time series so seasonal decomposition will not be possible. There are no data points within each year to determine seasonal variations.


But do not worry! In the future, we will cover additional time series data sets which do have multiple measures through each year, enabling us to perform the seasonal decomposition. The posts will be linked back to here.


We can model the time series further by using regression.


Regression


We covered linear regression with chemical predictors in this post. With our wheat time series, we can use the years as the predictor to determine coefficients to fit a trend for the log of wheat production. The equation is modeled as follows where
t is the years variable:

log(wheat) = a0 + a1*t + a2*t^2 + e


log Wheat Regression
Evaluating the model summary, we see that both t and the squared term, t^2, are both significant in predicting the wheat production time series. Next we plot the fitted regression line over the wheat time series to observe the fit.


Plotting Wheat Regression
Look how well the red regression line fits wheat production. Not to shabby, and the R squared value confirms this, at 0.9798, which means nearly 98% of the variance is captured by the regression model.


However, the regression model is based on a parabola equation, with the t^2 term. So it appears that the continuation of the log of wheat production in fact decreases according to the regression model. Let us plot the prediction forecast for the log of wheat production to year 2020 based on our model.


Plotting log Wheat Production Prediction
We create a new data.frame with the two t terms from 1961 all the way to 2020 for the prediction data points. Then using the predict() function, we obtained the predicted values from the regression model for log of wheat production from 1961 to 2020 in wheat2.lmp. Next we transformed the wheat2.lmp into a time series and we plotted it with the log of wheat production time series:


And yes, the prediction does curve down! From the available data and quadratic regression model, the log of wheat production was modeled to be parabola-like. Thinking logically, wheat production should not decrease in the near future due to rising demand from the increasing world population. The regression model we have fits the wheat data we used to generate the model. 

In this case, it is difficult to forecast the model to future years using stl() because there is no seasonality in our data points (no seasonal decomposition here). By only using yearly points, we can only predict the trend. Here is a recent post with seasonal decomposition of Amazon stock prices.

In the future, take note of the time resolution of your time series data. If it lacks seasonal data points, it will be more difficult to forecast accurately by only relying on the overall trend.


One More Regression Model


Let us consider one more regression model based on the wheat production, rather than the log of wheat production. The larger values in log of wheat production actually correspond to higher values in wheat production, and the scale of the differences are much larger. So there is a possibility that the higher values in log production were closer together, resulting in a highly parabolic model. 

Using the regular wheat production numbers might alleviate this issue. Below we model the linear regression model with two terms, and plot the log prediction and the wheat production over the predicted wheat production time series.


wheat[,2] = a0 + a1*t + a2*t^2 + e


Wheat Production Regression Prediction and Plotting
By plotting both the log wheat predicted production and wheat predicted production, we can see which models the time series better into the future.


We see the regular regression through the red line, extending outwards but not quite decreasing (yet) by 2020. This is more reasonable than the prediction from the log of wheat production in blue, where after 2007, the predicted production drops. However, this is far from the finished model, and as more production data from subsequent years are obtained, those points can be added to the time series and enable us to predict the production in the near future better than without most recent data.

Through 2020 is where the model begins to break down (the log model begins at 2007), so with further data points, we can extend the forecast corresponding to the number of yearly data points we add.

Stay tuned for more time series in R!


Thanks for reading,

Wayne
@beyondvalence

Sunday, March 9, 2014

R Time Series: World Wheat Production and Harvest Area, Part I


Hello Readers,


Welcome back folks. Today we will revisit time series through the lens of World Wheat Production Quantity and Harvest Area. I recently discovered a data repository called Data Market, which has data sets by industry, country, and other various topics and sources, including the United Nations.

This particular data set on wheat was provided by the Food and Agriculture Organization (FAO) of the United Nations. This UN organization helps developing and developed countries "improve agriculture, forestry, and fishing practices, and ensuring good nutrition and food security." They are headquartered in Rome, Italy.


*Tasty Wheat*
The world produced 651 million tons of wheat in 2010. The cereal grain production was behind maize (844 million tons), and rice (672 million tons). Wheat is the leading source of vegetable protein in human food, and also the trade for wheat surpasses all other crops in the world combined.

So wheat is an important crop, and many of us eat some form of that cereal grain everyday, whether it be as bread or cereal product. So let us start number munching!


Getting Wheat from (Data) Market to R


Many data sets exist on Data Market, and with a quick search, we can find our wheat production data. I found the wheat data sifting through in the Food and Agriculture Industry under the Crops header, shown below.


Food and Agriculture Industry
Here it is, and after scrolling down and clicking explore, we arrive at the wheat data page. Make sure to select "Area Harvested" in addition to the "Production Quantity" under "Element/Unit". Multiple formats are available for download under the Export tab. I used the CSV format separated via commas. Choose a file format with which you are familiar.


Wheat Harvest Area and Production Quantity

Now that we have the wheat CSV data, we can import it into R and begin the analysis.


Wheat Data


We saw what the data looked like online, and we would like to reproduce it in R. Let use plot the wheat time series data.

First read in the CSV file, and now we have 3 columns with 48 rows of data. The first column in wheat denotes years, the second- Area Harvested in hectares (Ha), and the third- Production Quantity in metric tonnes. Note the last row. It is a comment-NA and we need to remove it. Also, let us specify the beginning of the time series at year 1961 with 1 measurement per year. 

We can do all this by selecting the elements of wheat to convert into a times series object. The first column is not required and the 48th row needs to be excluded, which gives us wheat[-48, 2:3]. The time units are described as starting in 1961, with 1 measurement per unit time.


Reading in Wheat CSV
Now we can plot the wheat data with plot(). First plot the Production Quantity in the second column of wheat, then add the Harvest Area in the first column with lines(). The default x axis tick marks only print by decade so I specified a custom x-axis with axis() and the pretty() function for aesthetics. It is a useful function for axis customization, along with legend() to clarify the plot lines.


Plotting Wheat
And below we have the world wheat production in tonnes (metric) and harvest area (Ha) graphic. Observe a general trend upwards in wheat production over 47 years, with a relatively stable harvest area. It appears that the amount of wheat produced per area has increased dramatically over the years.


Wheat production in 1961 measured about 222 million metric tonnes and in 2007, it had increased to over 600 million metric tonnes. Surprisingly, the Harvest Area remained relatively stable from 1961 at 204 million hectares to over 214 million hectares in 2007.


Perhaps this relationship would be better visualized in a plot of the ratio of the two series. Take the the production series and divide it by the harvest area to obtain the ratio.


Wheat Ratio Plot Code

Observe the ratio close to 1.09 at 1961 and rising to around 2.82 in 2007. This is a 260% rise in wheat production efficiency per hectare over the 47 years.


Those figures are obtained below by dividing the ratio from 2007 by the ratio from 1961:


Wheat Production per Hectare


Time Series Distributions of Wheat


Before we dive into any time series decomposition, let us look at the distribution of wheat Production Quantity and Harvest Area first. Since the tonnes of the wheat produced and hectares used number in the hundred millions, we will make the production quantity and harvest area more manageable by passing it through the
log(). Then we plot the differences between each measurement with diff() to see how the time series elements differ from each other.


Plotting Wheat Distributions

The abline(0, 0) simply adds a line y=0 to designate no difference between points as a reference.


Most of the distribution for Production Quantity (red) lies above y=0, indicating that the differences between each element are mostly positive, and the over all trend of the time series is increasing more than it is decreasing. On the other hand, Harvest Area differences do not appear to lean towards either direction, and is more stable than Production Quantity. These observations are confirmed when looking back at the Wheat Time Series Plot.


Distribution Histograms


Another way to visualize the distributions is with a histogram. First, we plot production quantity with hist() and specify that it plot the probability density. Next we overlay the probability density line to show how distribution of probabilities on the histogram. Then we assume the differences follow a normal distribution so we calculate the mean and the standard deviation from the differences of the log of production and plot the parametric normal distribution over the histogram as well.


Histogram for Wheat Production Differences
Below we can see the rendered histogram for the differences of the log of wheat production with the density estimate and the normal distribution with production quantity parameters. According to the normal distribution, the mean lies above 0.0, indicating increasing successive production quantity values.


We can observe the more stable wheat harvest area distribution with the same code, only modified for column 1 of wheat, and different colors in the histogram.


Plotting Wheat Harvest Differences
Here we have a more balanced histogram of harvest area distribution, with both the estimated density and parametric normal distribution means above 0.0. This, again, shows that the wheat harvest area stayed relatively more stable over time than the wheat production quantity.


After analyzing the distributions of both wheat production quantity and harvest area, we have a better grasp of the wheat time series data. Now we can move on to time series decomposition- in the next post! (Had to cut this post here; it was getting too lengthy.) 

So stay tuned, and stay curious!


Thanks for reading,


Wayne
@beyondvalence