Hello Readers,

Here we will continue where we left off from querying US and World Twitter trends in Python. After we obtained the trends what else can we do? Using current international and US trends, we can create sets and perform intersections of the two trending sources to see which are in common. Then we will search for tweets based on a common popular trend!
Just a quick note, remember to recheck your Twitter OAuth tokens to ensure that they still are the same. Update them if they have changed, or else your previous script will not work presently. Also, I am running the python code as script from the command prompt, which is why the results have a black background.
Let us get started.
Twitter Trends as Sets
From the last post I demonstrated how to obtain the OAuth keys from Twitter by creating an app. Using the keys, we were able to access Twitter API using the twitter module. Afterwards we queried world and US trending topics and for this post, I queried the topics again to obtain recent trends. Here are some recent (as of the writing of this post) US trends shown in json format:
 |
| US Trends- json format |
Yes, the '#Grammys' were on, and 'Smokey the Bear' was a trending item too, apparently. Next we will use the world and US trends and determine if there are any similar items by using the intersection of sets.
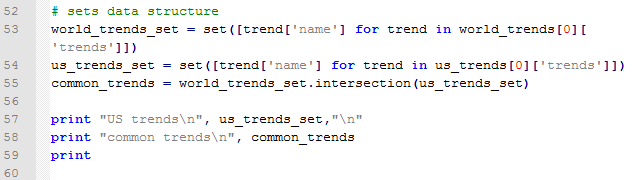 |
| Finding Similar Trends |
Below we have the results for the US trends as well as the intersection of the US and world trends. Note that the similar trending topics were: '#BeyonceAtGrammys', '#TheBachelorWedding', and 'Bey and Jay'.
 |
| US Trends and Popular Trends |
Searching Tweets
Now that we have trending topics, we can search for tweets with a specific trending topic, say '#TheBachelorWedding'. We use the twitter_api.search.tweets() to query for tweets. However, we will take this one step further and query for more results with a for loop. Inside the search_results metadata there is a heading for 'next_results', which we will keep querying 5 times and add them to the statuses (tweets). Additionally, we will using '+= ' to modify statuses in place with new search_results.

One notion we must be aware is cursoring, as Twitter does not use pagination in the search results. Instead, we are given an integer signifying our location among the search results broken into pages. There is both a next and previous cursor given as we move along in the search results. The default cursor value is -1, and when we hit 0, there are no more results pages left.
Here are the results for the first status-tweet. It is quite extensive for a 140 character tweet, with 5kb of metadata. The tweet was:
"Catherine and Sean are perf. Bye.  #TheBachelorWedding"
#TheBachelorWedding" |
| Tweet Data! |
It is so lengthy that I had to truncate the results to capture it! I circled the tweeter's handle: @ImSouthernClass.
 |
| More Tweet Data! |
Fantastic, we were able to query tweets based on the popular trends we obtained from Twitter. Next we will analyze the metadata behind multiple tweets and trends! So stay tuned!
Thanks for reading,
Wayne
@beyondvalence